TPIA manages the dam to influence the water levels on Thomas Pond by controlling the release of water over the dam. Our goal is to keep the pond level within a mutually agreed upon narrow range.
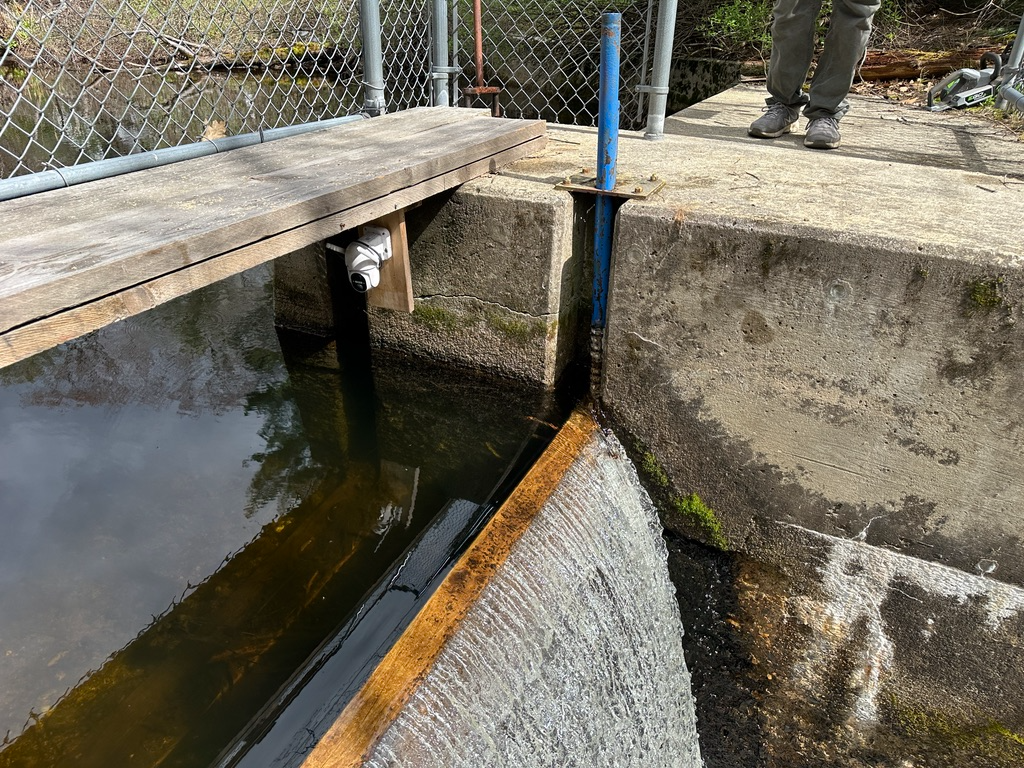
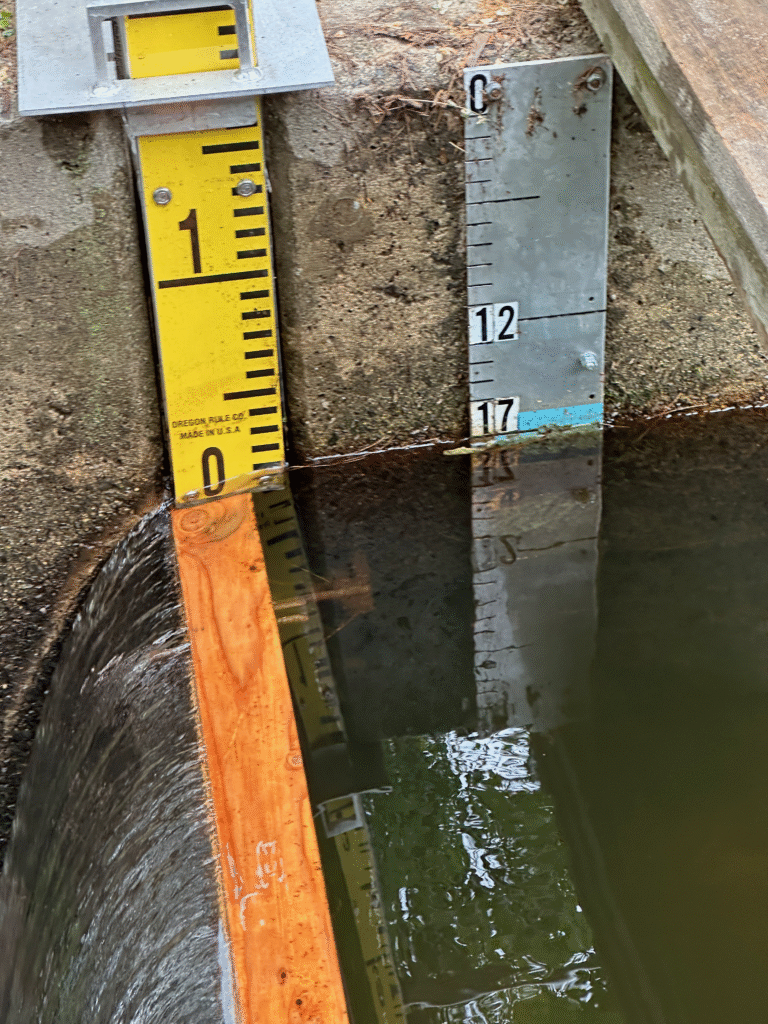
We do this using “stop logs”, essentially 4×4 and 2×4 planks that are held in place by slots in the dam and hydrostatic pressure from the water flow.
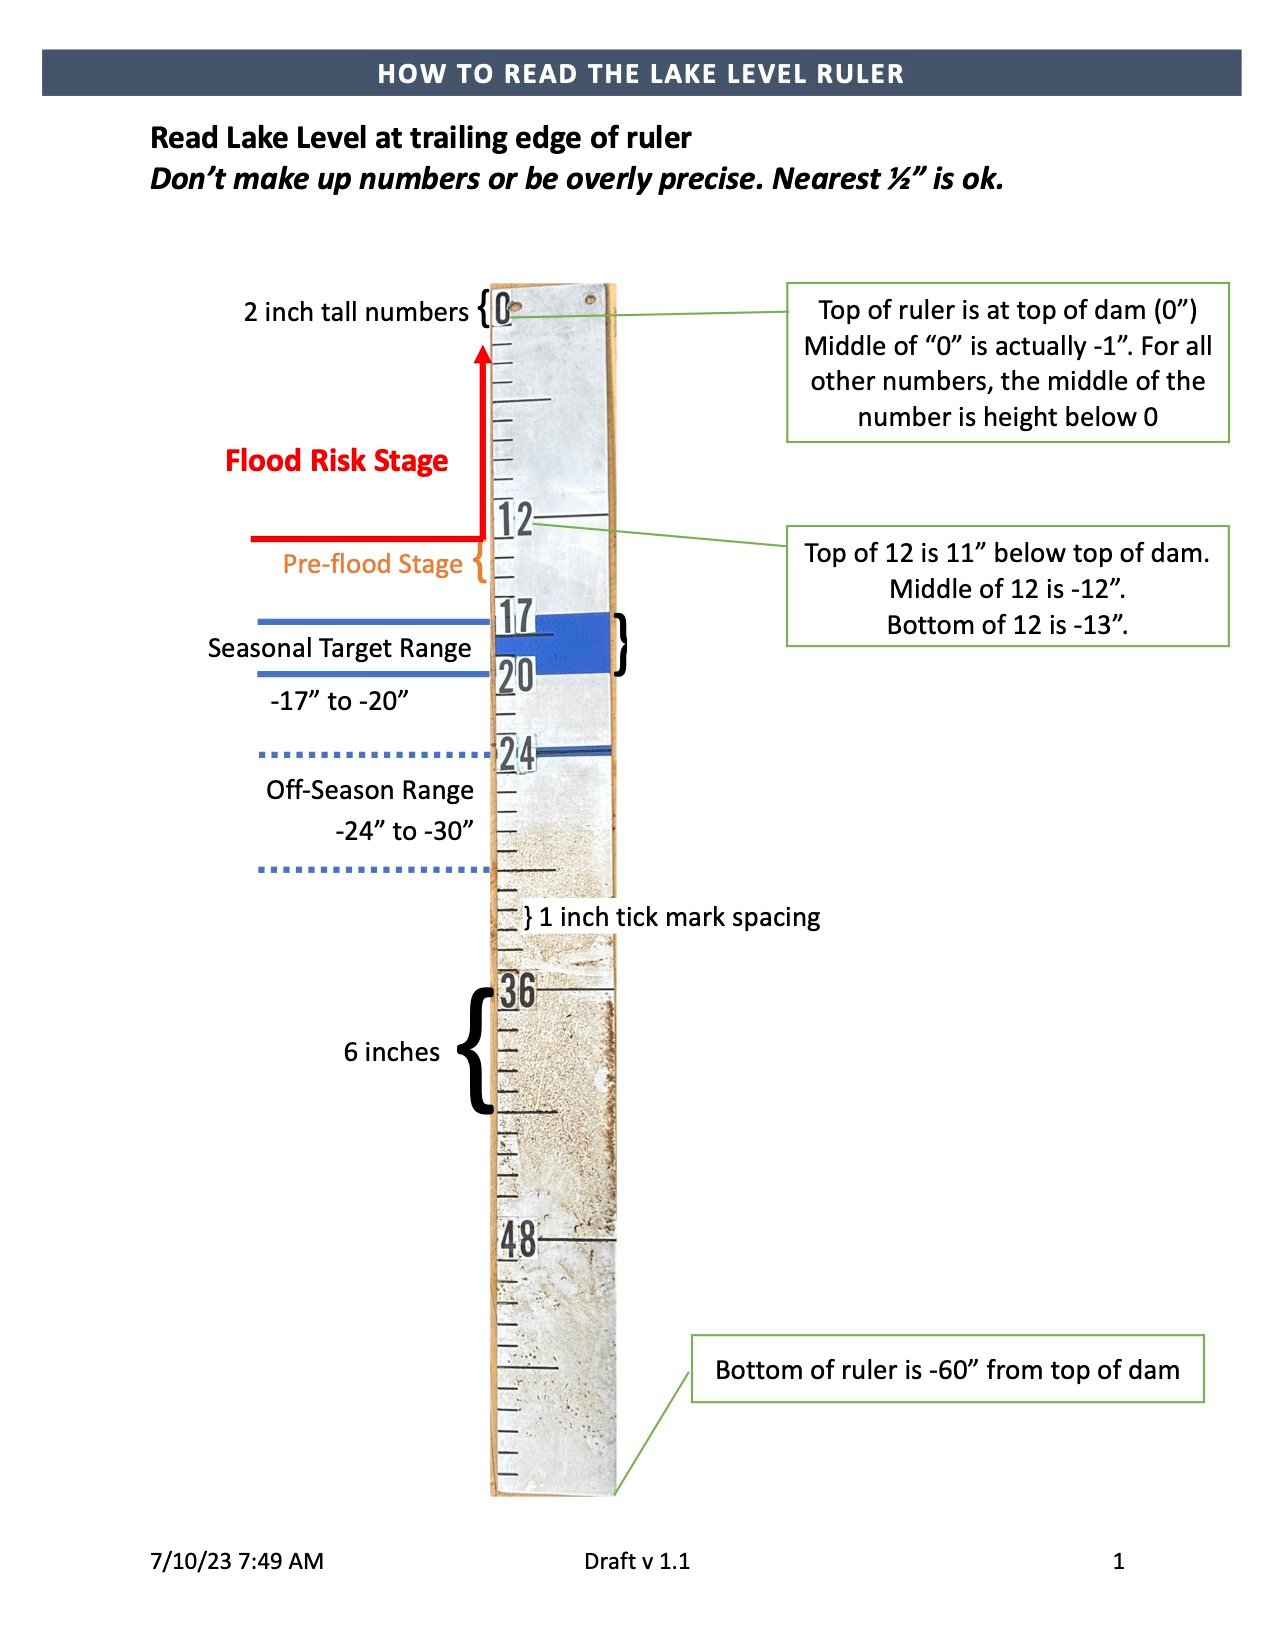
Water ranges are based on mutually agreed upon levels established in 1990. They are largely the same today, as confirmed by a survey in 2023. These levels are documented in the Dam Management Plan (original plan) and summarized below.
| Period | Desired Max | Desired Min |
|---|---|---|
| In-Season | -17″ | -20″ |
| Off-Season | -24″ | -30″ (new in 2024) |
TPIA generally monitors pond levels daily and tracks them against the desired range. Recent results are summarized below.
| Condition | 2024 Days | 2025 Days (to 8/1) |
|---|---|---|
| In Range | 190 | 176 |
| Near Range (±1.5″) | 45 | 25 |
| > 1.5″ Below Range | 92 | 0 |
| > 1.5″ Above Range | 32 | 15 |
1.5″ is the minimum adjustment we can make, so we count being within 1.5″ of our target as “near range”. We consider it acceptable for short periods of time.
When there is little to no rainfall, water levels inevitably fall below our desired range (hence 92 days below range in 2024, almost all in-season).
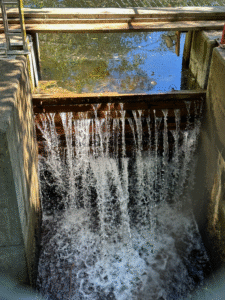
Keeping water flowing over (and through) the dam is also critical (and required by DEP). TPIA must maintain a minimum flow equal to the Aquatic Base Flow (ABF), which for Thomas Pond is 1.18 cubic feet per second, or about 1.8″ of flow over the dam. In spring there is a maximum flow of 12″, and only in extreme rain events or very high pond levels will we exceed that any time of year.
seepage through the dam
The table and graphs below only account for flow over the dam. We have no reasonable way to measure seepage during normal dam operations. We have measured seepage a few times when doing work on the dam with results between .3 and .5 cubic feet/second. So while we sometimes measure flow over the dam below ABF, that does not mean that total flow is really too low.
| Flow Rate | 2024 Days | 2025 Days (to 8/1) |
| ≥ Min flow (ABF) | 295 | 203 |
| ≥ Min level/< ABF | 2 | 3 |
| < Min level & < ABF | 35 | 5 |
| > Max desired flow | 25 | 3 |
When the pond level is below our range, TPIA may obtain permission from the Maine Department of Environmental Protection to allow flow to drop below the normal minimum of the Aquatic Base Flow. That happened in both 2024 and 2025.
Beginning in 2023 we moved to an online logging system. In 2024 we changed the log format. Here is the log, for a larger version click the link below.
Live link to the 2024 to today Dam Logs
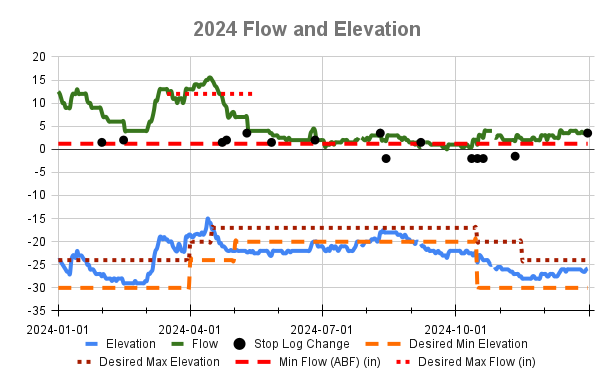
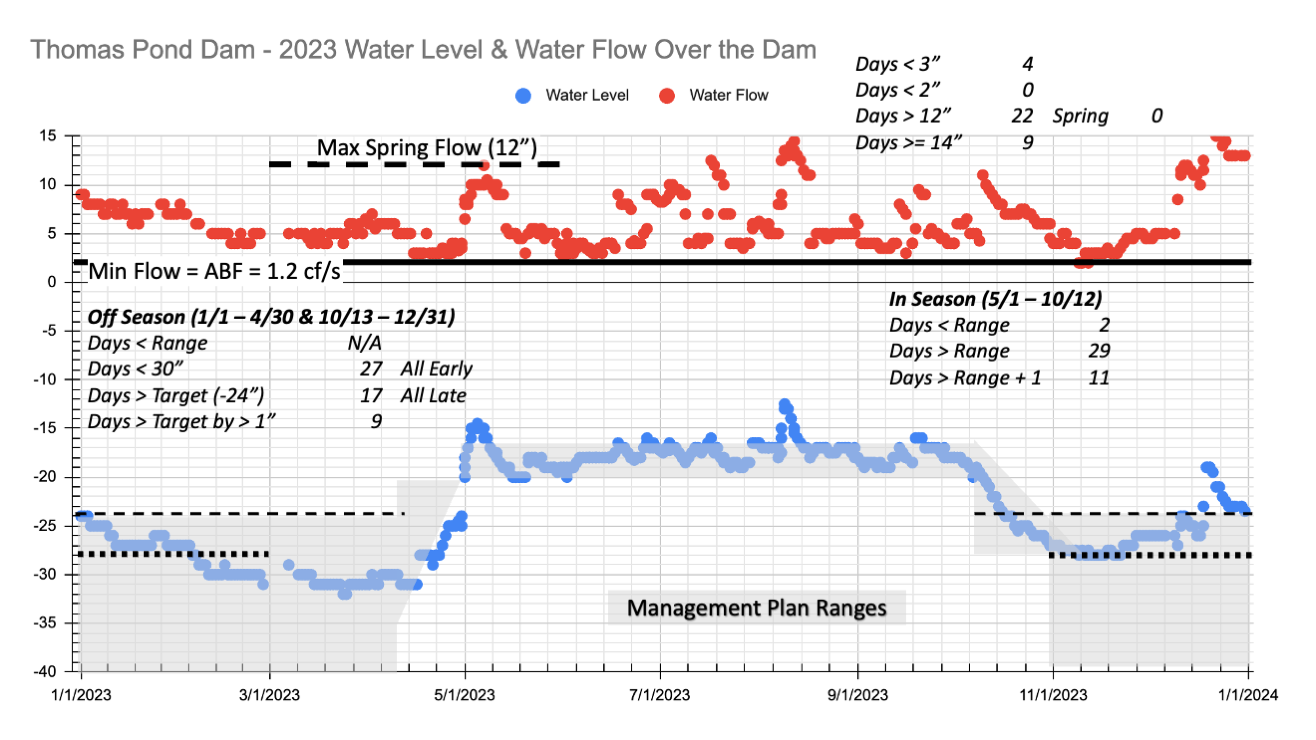
For those who are visual thinkers, here are performance charts for pond elevation (level) and flow over the dam.
Live link to the 2025 YTD Chart
TPIA can only influence the pond level by varying the amount of water that leaves the pond over the dam. Only mother nature can put water into the pond. The two charts below summarize the annual precipitation.